Exposure ManagementPlatform
Users were used to looking at security problems one list at a time. The new platform showed how everything connects. The design job was moving people across that mental-model shift without losing their trust.
Result
21 → 6
clicks on the most time-consuming routes
- RoleDesign Lead
- Timeline8 weeks
- WhenDec 2024 – Jan 2025
- Team6 disciplines
- UsersSecurity analysts, security teams, CISOs
- PlatformWeb app · enterprise
Exposure score
72/100
▼ 6 in 3 weeks · High
Internet-facing assets34%
Critical weaknesses28%
Failing controls22%
Account hygiene16%
Cloud control coverage
84%
▲ 3.2% this week
Attack surface
1,247
42 new assets
Open findings
318
12 since yesterday
Top findings
| Finding | Severity | Status |
|---|---|---|
| Critical | Open | |
| Critical | Open | |
| High | Open | |
| High | In progress | |
| Medium | Resolved | |
| Low | Open |
Exposure path
5 steps · 1 failingRemote code execution · api.gateway
- SourceInternet
- Assetcdn-edge-02
- Assetapi.gateway
- WeaknessCVE-2024-23113
- ControlPCI-DSS 6.3.3✕ failing
- TeamFinance
Working recreation. Press L for the decision behind each part.Open “Design notes” in the footer for the decision behind each part.
NDA Interactive recreation with sample data. These are not production screens or customer data.
In 30 seconds
- 1
The problem
Customers of two separate security tools had to move from reading lists to reading relationships, without losing trust in a platform they relied on.
- 2
What I did
I sequenced the shift: familiar entry points kept, shorter routes, backtracking through every relationship view, scores that show their working, and severity that never relies on colour alone.
- 3
The outcome
The most time-consuming routes went from 21 clicks to 6, and people no longer lose their way six or seven clicks deep.
Jump toKey decisions Results
01The problem
Three teams needed three different things from the same release
Prevalent's cloud security and attack surface products showed risk as separate lists. A shared data model could connect them, linking a security issue to the device, policy and team it affects, and become the foundation for everything Prevalent built next, including Navigator and Studio.
I owned the platform UX strategy, from the v2.0 navigation and product structure to the customisable overview dashboard, exposure paths, score derivation and an accessible severity system.
Three needs competed: existing customers needed continuity, sales needed a visible platform story, and engineering was still building how the data came together. We agreed up front that adoption risk would decide ties. That turned recurring debates into quick decisions.
Constraints
- Existing customers
- No forced migration of the workflows they relied on.
- Sales
- Needed visible, differentiated capability to position the platform as exposure management.
- Data still being built
- Engineering limits on how quickly and completely relationships could be surfaced.
- Accessibility
- Dense, colour-coded security data had to remain legible without colour.
Customers had to learn a new way of reading risk
Findings were judged without asset or business context, and scores couldn't be traced back to the data behind them. Connecting everything solved that on paper. But relationships are harder to read than lists.
Two risks dominated: overwhelming users with interconnected data before they were ready for it, and losing their trust if exposure calculations couldn't be explained.
The briefAdd a map view to the product.
The brief, rewrittenMove users from lists to relationships without losing them on the way.
02Research
Analysts had the data. They were missing the context
The core insight came early. Research then focused on how much context helps before it starts to hurt.
How
- Workflow mapping
- Mapped how existing users sort, investigate and report on issues, including the workarounds between the two products.
- Stakeholder sessions
- Working sessions with sales, engineering and customer success to surface the competing needs early.
- Terminology testing
- Tested new concepts (exposure, path, blast radius) for whether users could explain them back in their own words.
- Depth testing
- Followed people through relationship views at increasing depth, to find where they lost their way.
What we learned
- 01
Context, not data
Users already had more findings than they could act on. What they lacked was why a finding mattered here.
Which led to Every finding resolves to its asset, control and business unit.
- 02
Lost after six or seven clicks
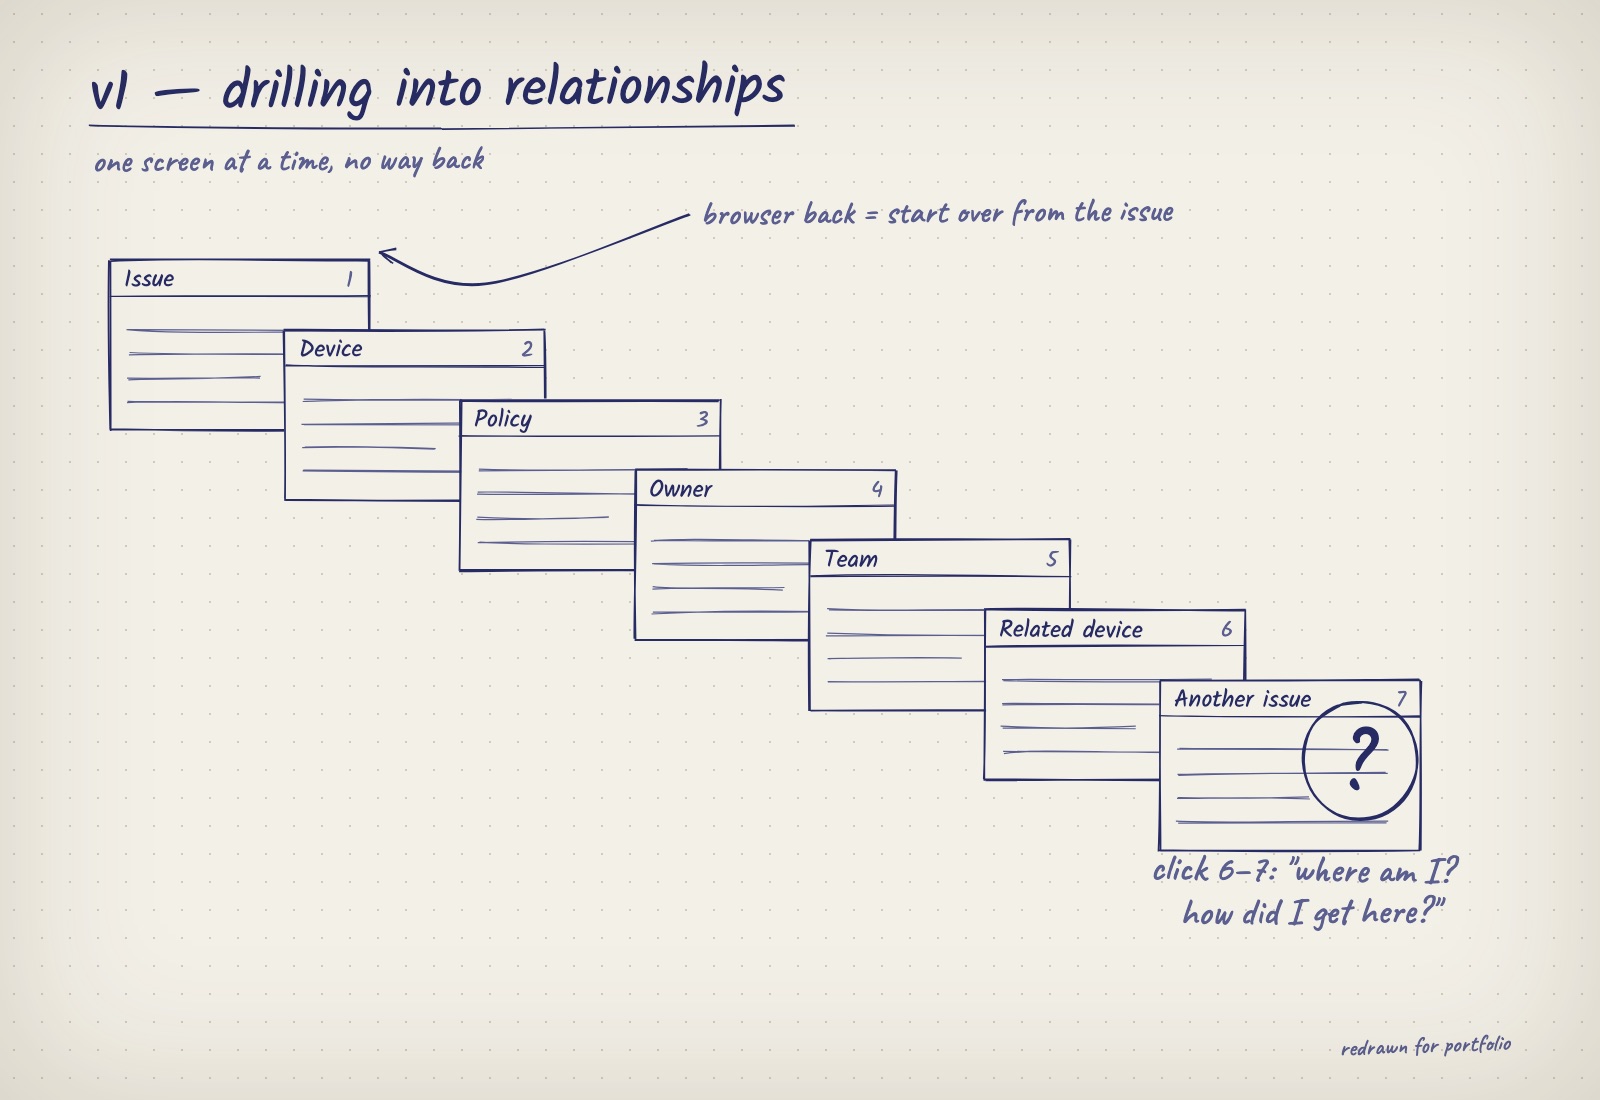
Following relationships from finding to asset to control, people lost track of where they were and how they got there after six or seven clicks.
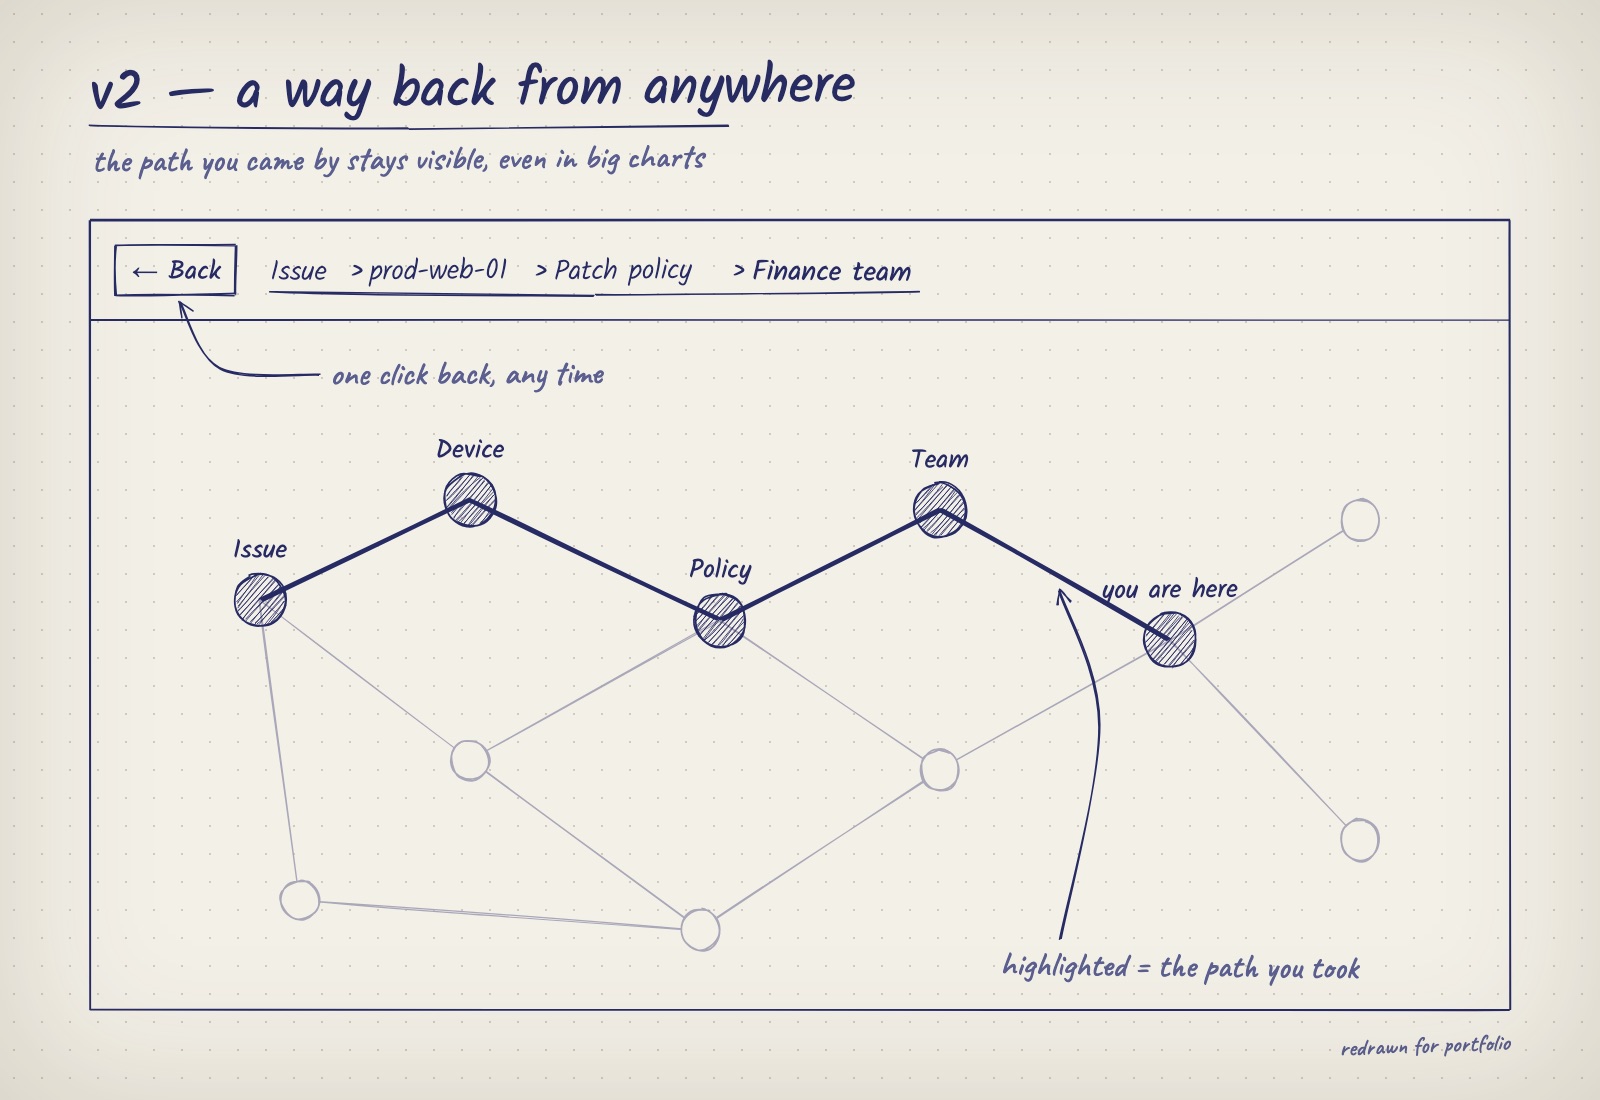
Which led to Backtracking everywhere, including inside complex relationship charts, so the path you came by is always visible.
- 03
The slowest routes took 21 clicks
Counting clicks on the most time-consuming routes through the product gave a concrete baseline to design against.
Which led to The v2.0 navigation, rebuilt around those routes.
- 04
"Why is this critical?" comes first
The most common question about any score was how it was derived.
Which led to Scores that decompose into contributing factors and trend.
- 05
Familiarity is trust
Users were willing to adopt new views when they started from screens they already knew.
Which led to The two products kept their place in the navigation, with connected context added inside.
03Approach
Principles for this product
- Anchor the new in the familiar
- New concepts attach to existing navigation, language and workflows.
- Show the working
- Any number on screen can be traced to the data behind it.
- Sequence, don't flood
- Introduce new ideas in an order people can absorb.
I tested three ways to show relationships, at increasing depth
I explored map, table and path representations of the same exposure, and tested each at increasing depth. The validation rule was simple: a design only advanced if users could explain exposure back in their own words. Preference didn't count.
Tried and set aside
- Relationship map first
- Impressive in demos, but comprehension fell as depth increased.
- New unified navigation
- Built around the map, with a relearning cost for every existing customer.
- Colour-only severity
- Fails WCAG 1.4.1, colour-blind analysts, dim control-room screens and black-and-white exports.
Sketches
Redrawn for this portfolio. The original work is under NDA.
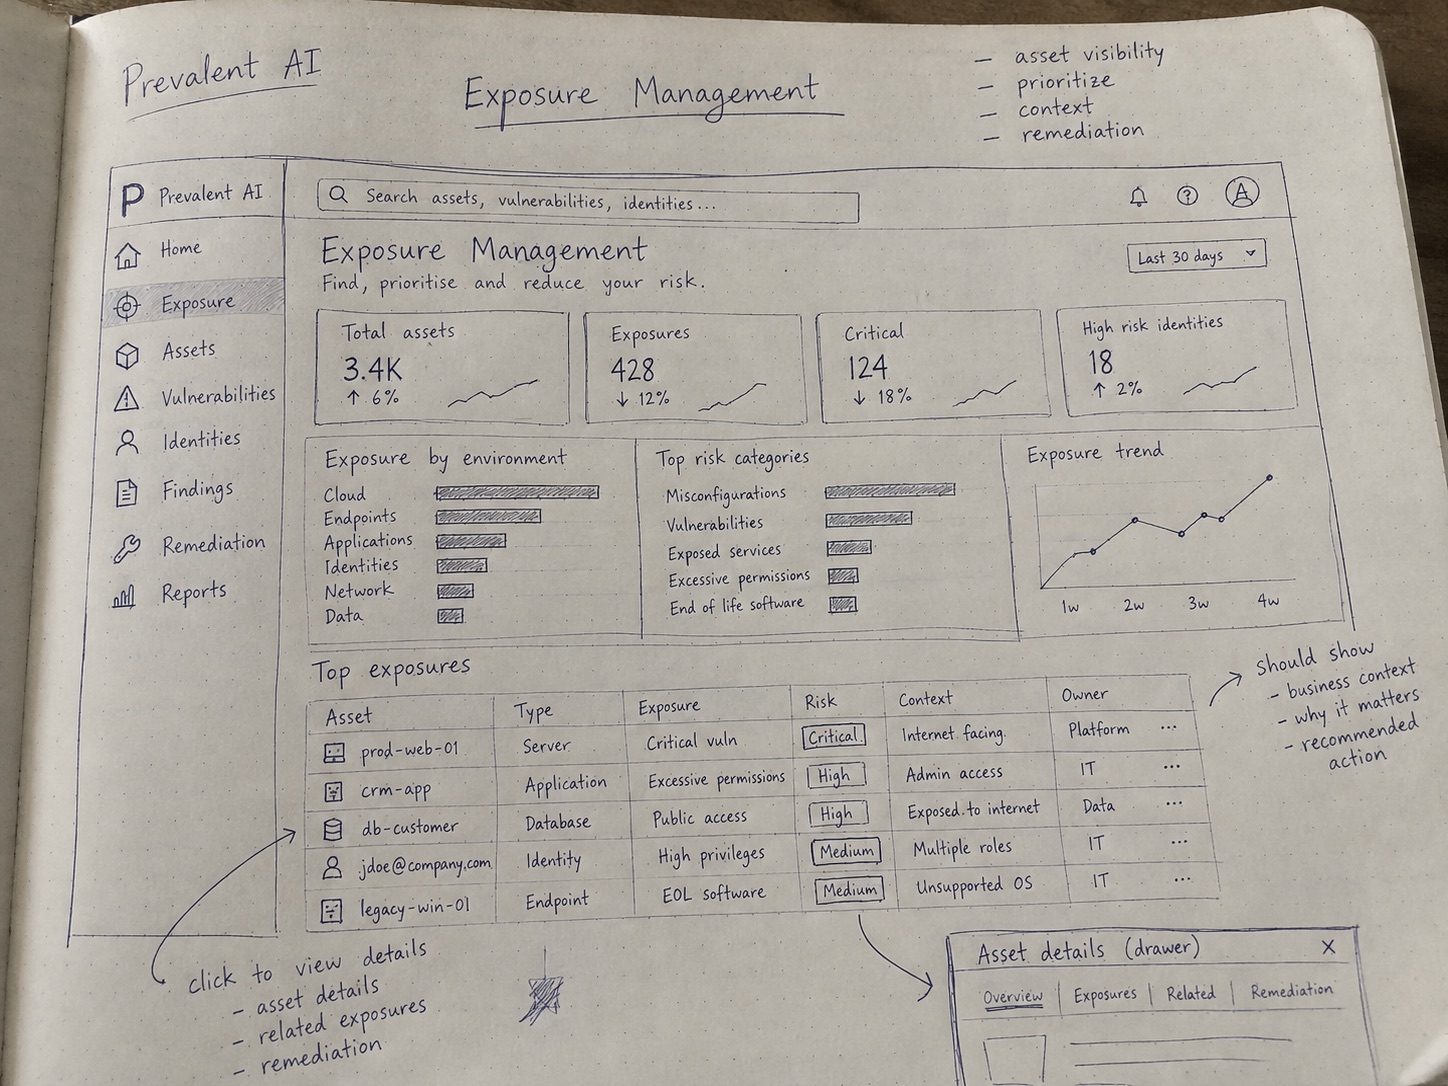
The overview: find, prioritise and reduce risk. Every row in Top exposures should show business context, why it matters and a recommended action. 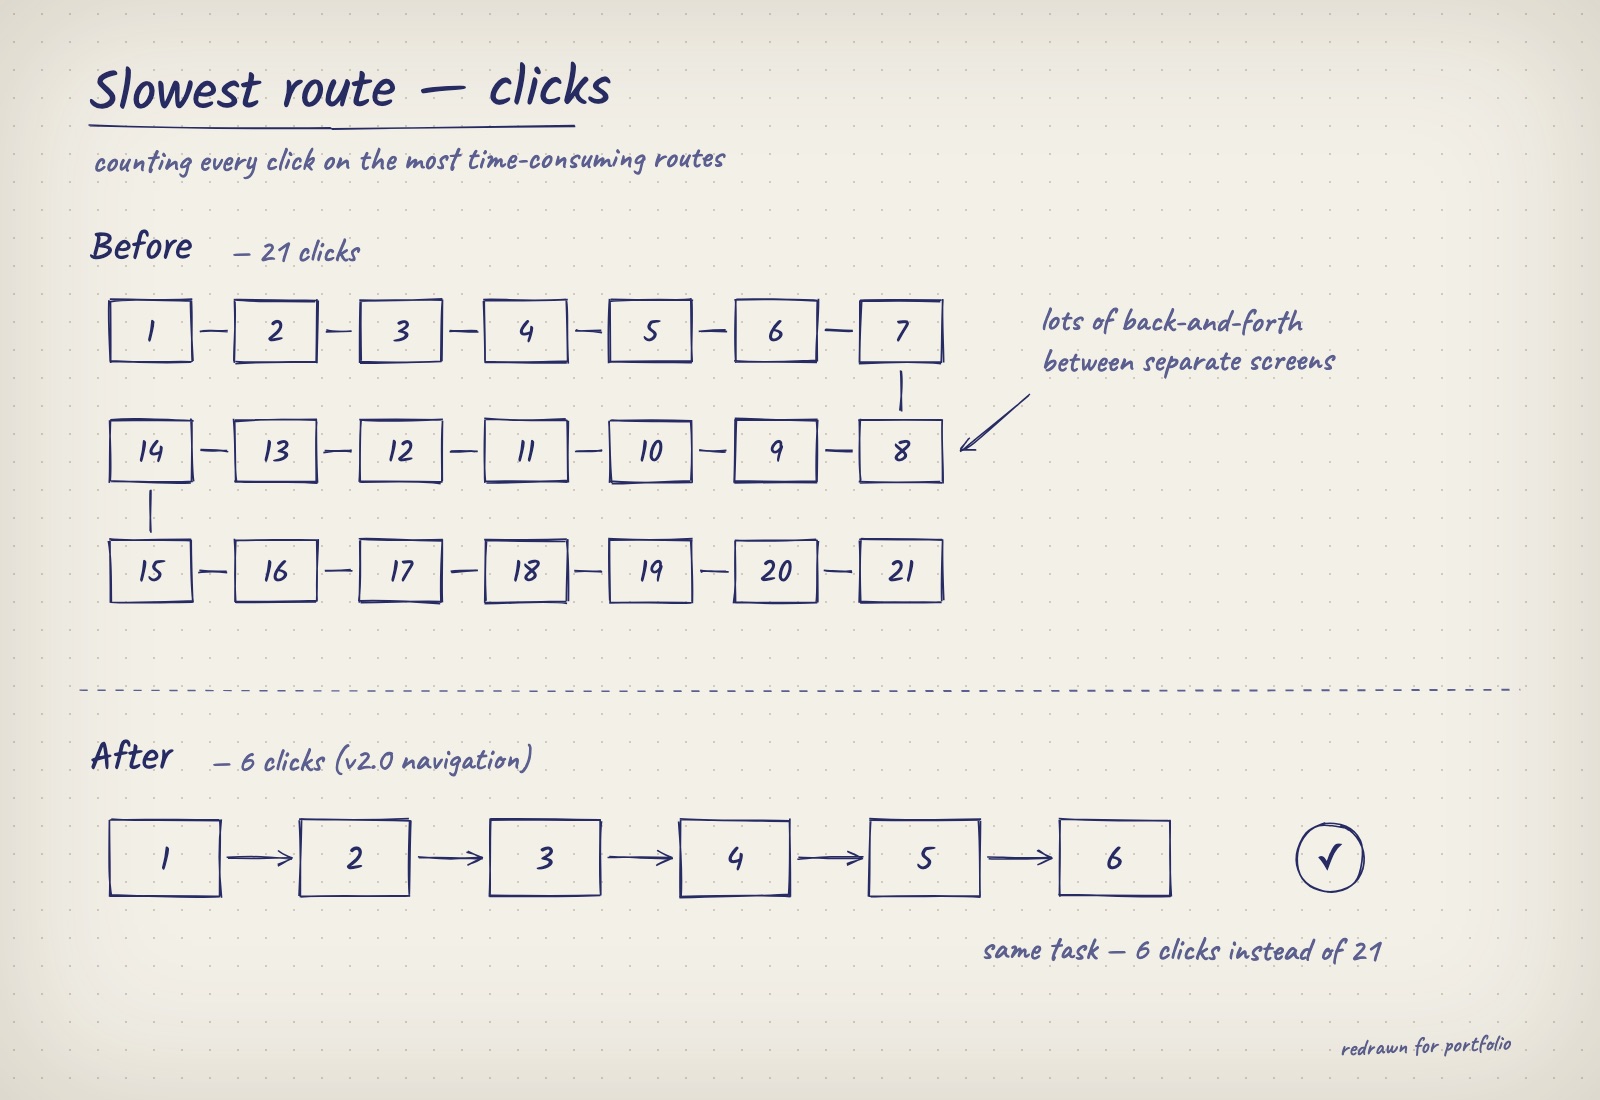
Counting clicks on the slowest routes gave a baseline to design against (21 before, 6 after the v2.0 navigation). 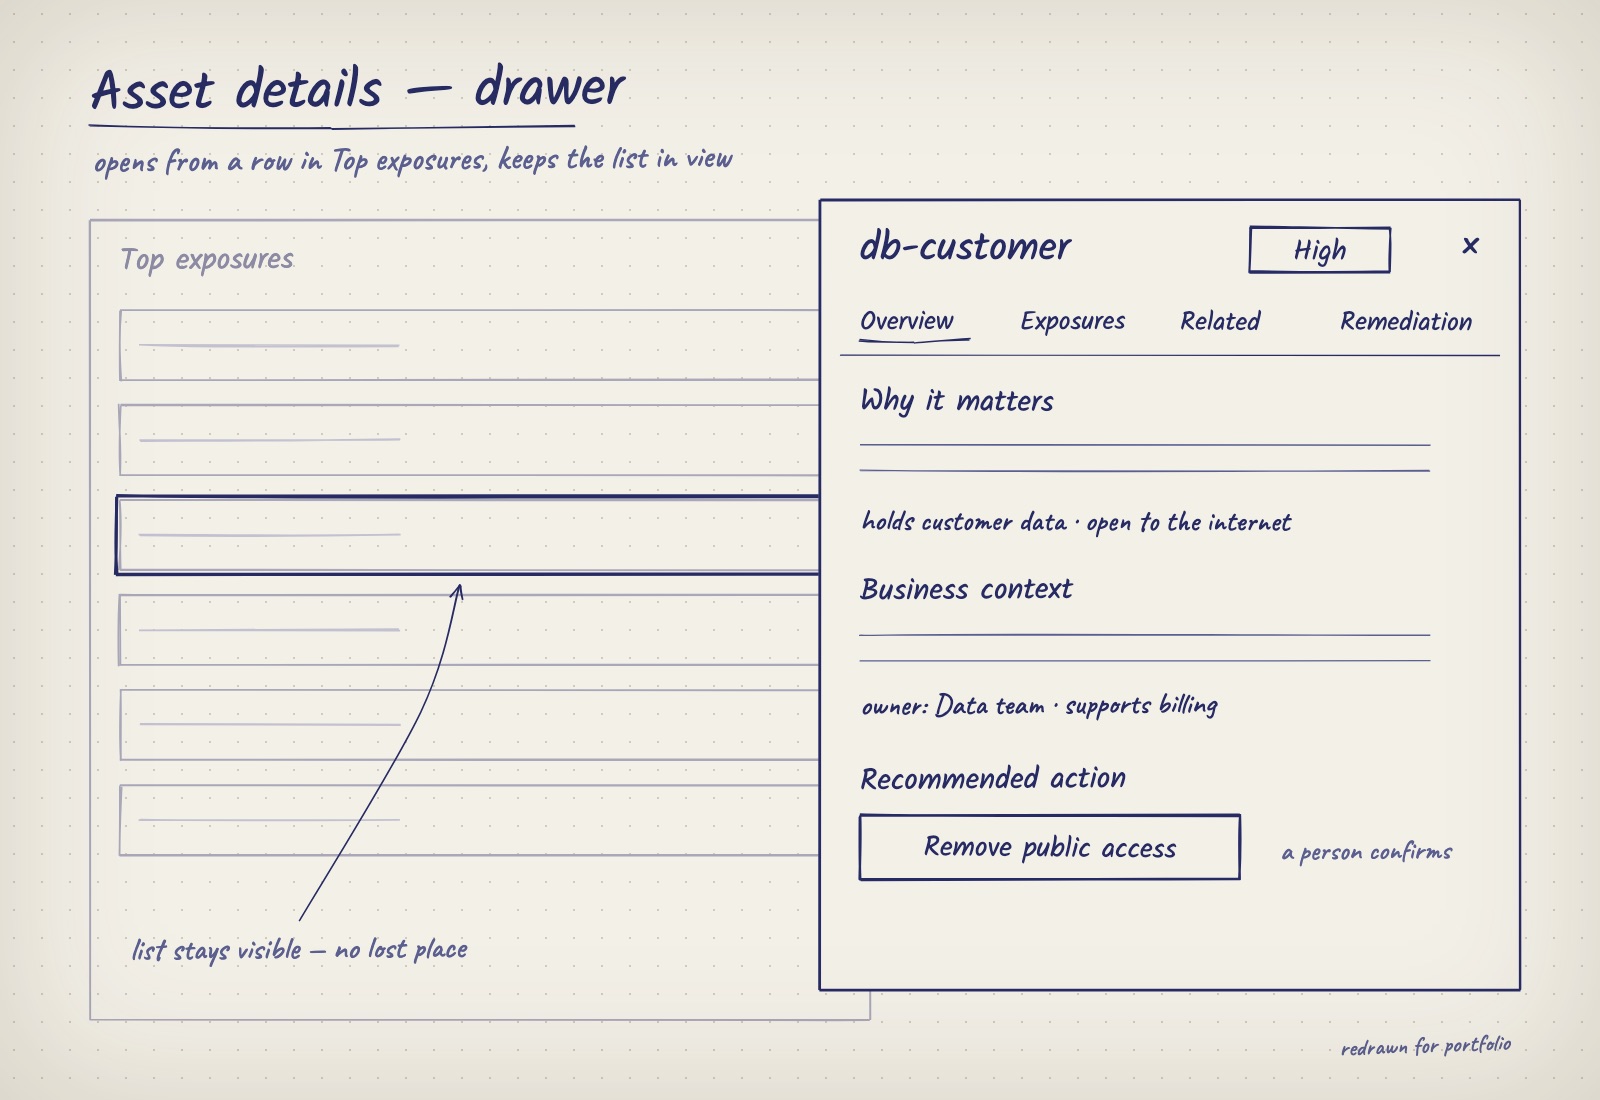
Details open in a drawer, so the list stays in view and nobody loses their place. 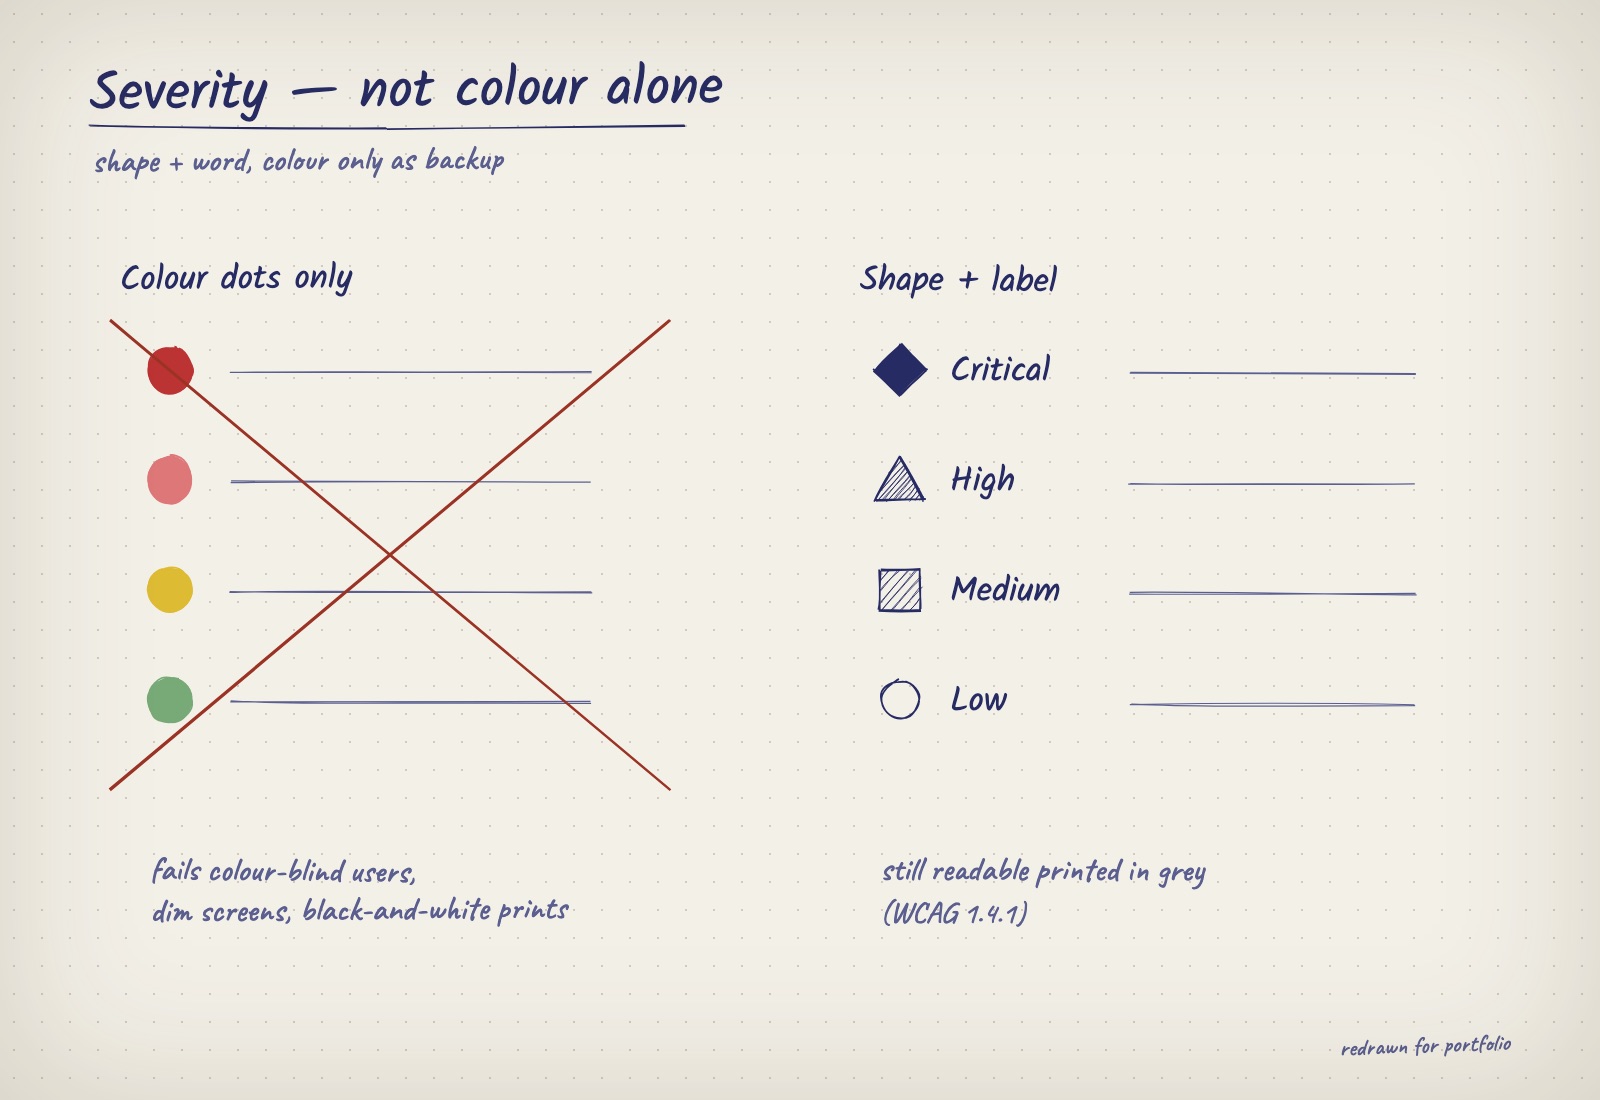
Severity carried by shape and word, with colour only as backup.
04Decisions
Decision 01Progressive disclosure of relationshipsWhat I chose A linear exposure path for the selected finding, with the full map available but secondary.
- What I turned down
- An exploratory relationship map as the primary view.
- Why
- In testing, comprehension fell as map depth increased. The path answers "how is this exposed?" directly; the map remains for experts who ask for it.
- What it cost
- The platform's most impressive view became its least prominent one.
Decision 02A way back from anywhereWhat I chose Backtracking on every relationship view, including complex relationship charts, showing the path the person took to get there.
- What I turned down
- Relying on the browser back button and breadcrumbs that only reflect the page hierarchy.
- Why
- People lost their way six or seven clicks into the map. Exploring relationships is only safe if getting back is effortless.
- What it cost
- Another layer of chrome on views that are already dense.
Decision 03Preserve familiar entry pointsWhat I chose The two existing products stay in the navigation where users expect them, with connected context added inside each.
- What I turned down
- A new unified navigation built around the map.
- Why
- Relearning cost would have stalled adoption among existing customers, the people the platform most needed to keep.
- What it cost
- Slowed how quickly sales could show the full platform story.
Decision 04Severity without relying on colourWhat I chose Each severity has a distinct shape and a text label, with colour as reinforcement.
- What I turned down
- Colour-only badges and dots.
- Why
- Colour-only signals fail WCAG 1.4.1, fail colour-blind analysts, and degrade on dim control-room screens and black-and-white exports.
- What it cost
- Slightly denser rows in tables built for scanning.
Decision 05Scores that show their workingWhat I chose The exposure score shows its trend and decomposes into the factors behind it.
- What I turned down
- A single headline number with a tooltip definition.
- Why
- "Why is this critical?" was the most common question. A score that can't be explained can't be defended upward.
- What it cost
- More on screen around every score. Worth it, because the score drives prioritisation.
A score people act on has to show its working
Exposure Management is the foundation Navigator and Studio are built on rather than an AI feature itself. But it is where the explainability patterns started: a computed score that ranks risk is only useful if the person ranking work can see why.
- Mental models
From lists to relationships, in sequence
Posture, then assets, then exposure, each introduced from an entry point users already knew, so the new model extended the old one instead of replacing it.
- Explainability & trust
Every number decomposes
The exposure score carries its trend and contributing factors, answering "why is this critical?" without leaving the view. Any number on screen can be traced to the data behind it.
Grouped by the themes of Google’s People + AI Guidebook.
Deliberately left out
- Full map exploration upfront
- Kept for later phases, once users were fluent in relationship views.
- Advanced configuration early
- Deferred to avoid front-loading complexity on top of new concepts.
- All relationships by default
- Only relationships that support the current task are shown.
Sequenced rollout
- Phase 1
Posture
Cloud controls stay where users know them. Each policy now links to what it protects.
Entry point Cloud controls
- Phase 2
Assets & attack surface
Attack surface joins the same view. Each device shows the policies and issues it connects to.
Entry point Attack surface
- Phase 3
Connected exposure
Exposure paths show how a risk reaches the business. The full map stays optional.
Entry point Exposure paths
Connected views were introduced in phases, each anchored to a familiar entry point.
05Testing
Depth was fine; getting lost wasn't
Relationships are the point of the platform, so the fix couldn't be to hide them. It had to be making every step reversible, and making the common routes short.
Navigating relationships
- First version
Drill from finding to asset to control to business unit, one view at a time.
- What testing showed
After six or seven clicks people lost track of where they were and how they got there.
- What shipped
Backtracking on every view, including complex relationship charts, so the path you came by is always visible and one step back is always available.
Drag to compare. Sketches redrawn for this portfolio; the original work is under NDA. - First version
06Results
One shared model, and nobody forced to relearn
- 21 → 6Clicks
On the most time-consuming routes, after the v2.0 navigation and multi-module structure.
- 6–7 clicksWhere people got lost, now fixed
The depth at which people lost their way. Backtracking now works everywhere, including inside relationship charts.
- 1Shared model
Two products brought together on one shared model, with every issue linked to the device, policy and team it affects.
- 0Forced migrations
Existing workflows preserved; connected views adopted from familiar entry points.
What I’d measure next
- Time to first action
- From finding to first action, to quantify what connected context saves against a baseline.
A new way of reading risk has to arrive in steps
- Sequencing beats any single screen
- Introducing new ideas in the right order did more for understanding than any one screen.
- Test comprehension, not preference
- The full map demoed brilliantly and performed poorly in tasks. Asking users to explain exposure back kept the design honest.
- Set a baseline first
- I'd measure how long it takes to act on an issue before launch, so the value of the redesign can be compared.
- Next: open exploration for experts
- Now that users read paths fluently, introduce the relationship map as an opt-in expert mode.
- Next: what-if remediation
- Simulate how patching one asset changes the score and the paths through it, to prioritise by impact.