Case Study · 03 — Prevalent AI
A unified exposure view across assets, controls, and attack surface — shifting analysts from siloed risk assessments to a connected, knowledge-graph-powered understanding of their environment.
The platform brings together cloud controls, external attack surface data, and internal asset context through a shared knowledge graph to present exposure as a connected system rather than isolated findings.
Design focuses on helping users navigate relationships, dependencies, and impact, enabling clearer understanding and prioritization across complex security environments.
The primary risk was overwhelming users with interconnected data before they were ready to interpret or trust it.
I was responsible for shaping how these capabilities came together into a coherent experience — particularly how existing users transition into a relationship-based exposure model without losing trust in the platform they already relied on.
The challenge was not introducing new capabilities, but reshaping how users understood exposure.
Users were used to evaluating cloud posture and assets in isolation. The introduction of a knowledge graph shifted representation from lists to relationships, requiring a fundamental mental model change.
Overwhelming users with interconnected data, and losing trust if exposure relationship calculations were not transparent or explainable.
Existing customers needed familiarity and continuity to avoid disruption.
Sales required visible, differentiated capabilities to position the platform as exposure management.
Engineering constraints around evolving data pipelines limited how quickly and completely relationships could be surfaced.
Design decisions were made by continuously negotiating these tensions rather than optimizing for any single stakeholder. Each decision was made to manage adoption risk first, even when it limited feature visibility or technical completeness.
Enable existing users to continue core workflows while gradually introducing relationship-based views of exposure.
Represent assets, controls, and attack surface connections in a way users can interpret and validate.
Surface exposure management capabilities clearly, without overwhelming day-to-day users.
Introduce connected views incrementally, anchoring new concepts to familiar patterns and language.
Ensure users can trace how exposure is derived, reinforcing trust in the system.
Design layouts and interactions that adapt as data maturity improves, without frequent rework.
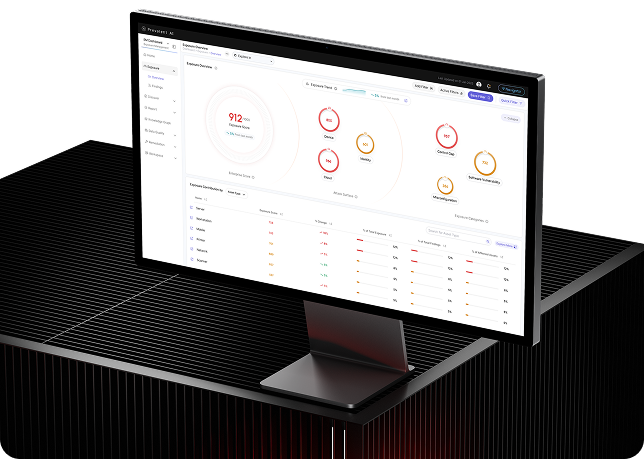
Knowledge Graph as the shared foundation — CCM and ASM built on top, creating a unified view of exposure rather than separate tools. Every finding links back to affected assets, controls, and business units.
Real-time exposure scores with trend data — not a periodic snapshot but a living picture of risk that updates with the environment. Analysts can see exposure change as remediation happens.
Every insight surfaces a clear next step — from CISO-level dashboards down to analyst investigation flows. No dead-end summaries; everything routes to a remediation path.
| Asset | Severity | Status |
|---|---|---|
| api.gateway | Critical | Open |
| auth-service | High | Open |
| db-cluster-01 | Medium | Resolved |
| cdn-edge-02 | Low | Open |
User disorientation and resistance to change. New exposure capabilities were anchored to existing navigation and workflows, allowing users to adopt connected views without abandoning familiar paths.
Cognitive overload and loss of trust. Rather than enabling unrestricted graph exploration, relationships were revealed selectively where they directly supported user intent and decision-making.
Information overload from simultaneous context shifts. Posture, assets, and exposure were introduced in a deliberate sequence, helping users build understanding incrementally instead of confronting everything at once.
Dense security data is organized using clear visual hierarchy and structured layouts to support fast scanning and comprehension.
Progressive disclosure, spacing, and grouping are used to manage complexity and prevent users from being overwhelmed.
Interaction patterns and visual language remain consistent across views to support predictable, efficient workflows.